How to Turn Spreadsheet Data Into Executive-Friendly Visuals With Python
If you want executive data visuals that actually get used, the first step is not picking a chart library. It’s deciding what an executive needs to know in about ten seconds. That usually means fewer metrics, clearer comparisons, and a visual hierarchy that says, “Here’s what changed, here’s why it matters, here’s where to look next.” Spreadsheets are great for storing detail. They’re terrible at making decisions obvious.
Here’s the thing: most spreadsheet-to-charts Python projects go wrong before a single chart is drawn. People dump every column into a notebook, generate a dozen colorful plots, and call it reporting. Executives do not want a tour of your raw data. They want a point of view. Before you touch Python, trim the spreadsheet down to the handful of fields that support a business question: revenue by region, forecast versus actual, margin trend, customer churn by segment. If the dataset doesn’t help answer one of those questions, it probably belongs in a supporting file, not the main visual.
Clean the Data Once So Your Reporting Automation Doesn’t Break Every Monday
Python shines when you stop doing spreadsheet janitorial work by hand. The usual mess is predictable: merged cells, weird date formats, blank rows, duplicate labels, percentages stored as text, and numbers with dollar signs embedded in them like little traps. A clean workflow means using pandas to standardize column names, parse dates, convert numeric fields properly, and fill or flag missing values in a way that makes sense for the business. Boring work, yes. Also the difference between trustworthy reporting automation and a dashboard everyone quietly stops believing.
A practical approach is to build one small cleaning script that does the same checks every time a new workbook lands in your folder. Rename columns to consistent snake_case names. Strip whitespace. Convert “Q1 2024” into real period labels. Make category values consistent so “North America,” “N. America,” and “NA” don’t show up as three different bars. Then add a few sanity checks: totals should be within expected ranges, required columns should exist, and dates should not be in the future unless that column is a forecast. This is the part that makes business storytelling possible later, because you can’t tell a clear story from data that keeps changing shape for no good reason.
Pick Chart Types That Respect Executive Attention Spans
The fastest way to lose an executive is to use a clever chart when a plain one would do the job better. For leadership reporting, the safe bets are usually line charts for trends, bar charts for ranking and comparison, and a simple variance view for actual versus target. That’s it. You do not need a sunburst chart to explain last quarter’s sales mix. You need one chart that shows whether performance is improving, flat, or slipping, plus enough context to make the movement meaningful.
Python gives you plenty of choices here. Matplotlib works fine for tight control. Seaborn makes clean statistical charts quickly. Plotly is useful when interactivity matters, especially if the report is shared digitally. But the real skill is not the library. It’s restraint. Use one accent color for the number or category that deserves attention, and keep everything else neutral. Label the important point directly instead of making people hunt through a legend. Sort bars in a meaningful order. Start axes at zero when comparison is the point. If you’re building executive data visuals, clarity beats decoration every single time.
Use Python to Add Narrative Cues, Not Just Graphics
Good business storytelling is not about turning analysis into theater. It’s about guiding attention. A chart without context often makes the reader do too much work: What changed? Is that good or bad? Is the gap meaningful? Why does this category matter? Python can help answer those questions directly by adding annotations, benchmark lines, arrows, target bands, and titles that say something specific instead of vague nonsense like “Monthly Performance Overview.”
Say you’re plotting monthly revenue. Don’t stop at the line. Add a label at the biggest dip with a note about a pricing change or supply issue. If you’re showing regional margin, highlight only the underperforming region in a contrasting color and keep the rest subdued. If the report includes forecast versus actual, add a simple delta label so the gap is impossible to miss. This is where spreadsheet to charts Python work stops looking like analyst output and starts feeling executive-ready. You’re not just displaying data. You’re framing the decision sitting inside the data.
Build a Repeatable Reporting Pipeline From Excel to Executive Dashboard
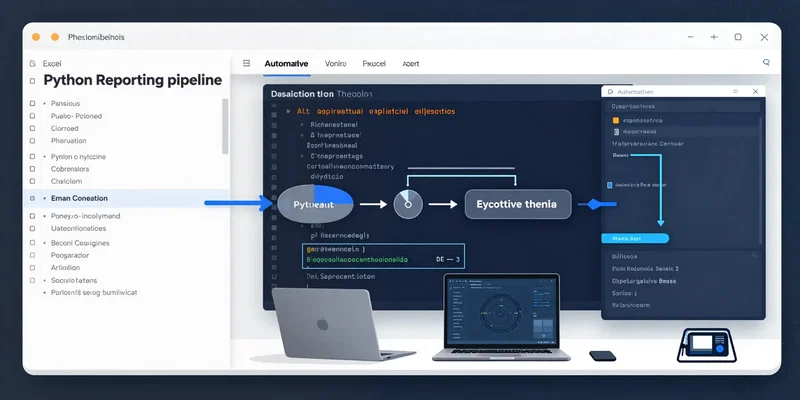
Once the visuals are right, automate the whole thing. That usually means reading from Excel or CSV files with pandas, transforming the data into reporting tables, generating charts, and exporting them to a format people will actually consume. For some teams that’s a PowerPoint deck. For others it’s a PDF, a shared image set, or an internal web app. The format matters less than the repeatability. If you can rerun the report with one command, you’ve saved more time than any chart tweak ever will.
A smart reporting automation setup also separates input, logic, and output. Keep the raw spreadsheet untouched in one folder. Store your cleaning and transformation code in a script or notebook that can be version-controlled. Save output charts to a dedicated location with predictable filenames. If you need a polished deliverable, tools like python-pptx, Plotly Dash, or even a simple templated PDF generator can bridge the gap from analysis to presentation. The point is not technical showmanship. It’s making sure the monthly leadership pack looks consistent, arrives on time, and doesn’t require an analyst to spend Sunday night dragging charts around in PowerPoint.
Fix the Common Mistakes That Make Executive Visuals Feel Amateur
A lot of bad reporting comes from habits people picked up inside spreadsheets: too many gridlines, too many decimals, too many colors, too many categories, and titles that say almost nothing. Executives don’t need twelve slices in a pie chart. They don’t need labels on every point of a dense time series. They definitely don’t need a rainbow. Clean reporting means reducing friction. Round where precision adds no value. Combine tiny categories into “Other” when appropriate. Remove chart junk. Write titles that carry meaning, such as “Margin fell 3 points after discounting in EMEA,” not “EMEA Margin Analysis.”
Actually, one of the most useful habits is to review every chart with a brutal question: if this were pasted into an email with no explanation, would the reader still know what matters? If the answer is no, fix the title, annotation, ordering, or metric selection. That’s the standard executive data visuals have to meet. Python gives you speed and consistency, but judgment still matters most. The final chart should feel obvious in the best way. Not simplistic. Just clear enough that the conversation moves quickly from “What am I looking at?” to “What should we do about it?”